As Larry Di Girolamo stood at Vandenberg Air Force Base in December 1999, he was a relatively new professor in what would become the Department of Climate, Meteorology, & Atmospheric Sciences at the University of Illinois. He had come to witness the launch of the Terra satellite into orbit—a spacecraft carrying an instrument he had helped design since his days as a graduate student, coding on a green-and-black monitor nearly a decade earlier. That early work would grow into a career-defining project that followed him through nearly every stage of his professional life.
As Terra soared skyward, carrying the Multi-angle Imaging SpectroRadiometer, he stood among teammates cheering so loudly his ears rang. They thought MISR might last six years. They had no idea it would still be operating 25 years later.
Now, the MISR mission is coming to a close. Originally intended to gather basic statistics about clouds and aerosols in Earth’s atmosphere, it became the longest continuous climate-quality satellite record, outlasting expectations by nearly two decades and reshaping what scientists understand about pollution, weather, and climate change.
And in one of its final acts, MISR helped confirm something that has long been theorized but never directly observed: the jet stream is shifting and speeding up, with consequences that ripple through global weather systems.
A CAT scan of the sky
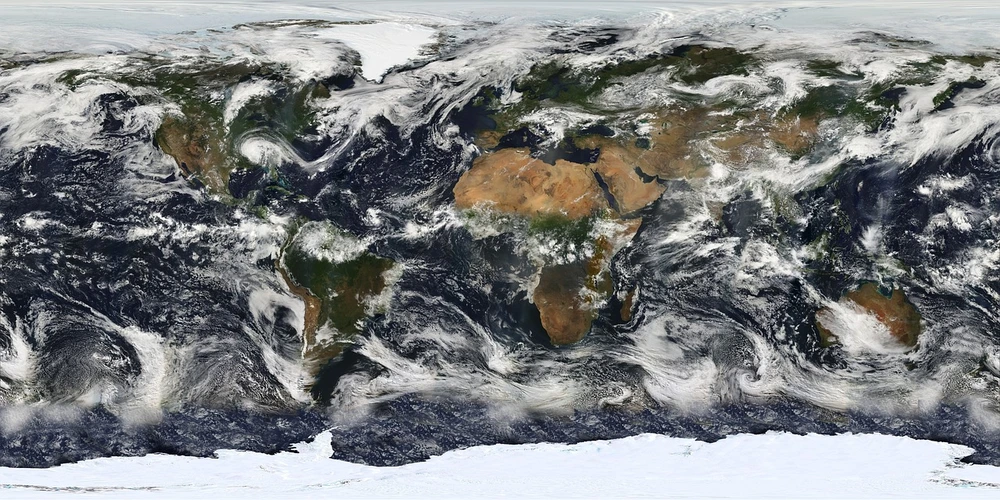
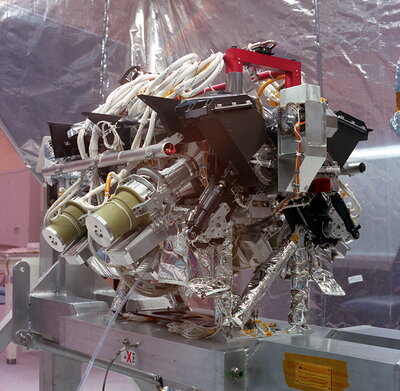
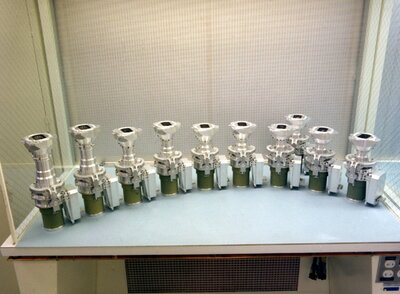
The MISR instrument was unlike anything launched before. While most Earth-observing satellites rely on a single, downward-looking camera, MISR used nine cameras at different angles, capturing 3D-like views of clouds, aerosols, and surface properties. Di Girolamo likens it to “a CAT scan of the atmosphere,” delivering vertical structure to the data rather than a flat snapshot.
“In science, we’re always trying to reduce the uncertainties in our predictions,” he explains. “One of the big missing pieces has been the 3D distribution of cloud properties. MISR is helping us fill in that gap.”
That information doesn’t just help climate scientists; it saves lives. Accurate cloud modeling improves weather forecasting, helping governments prepare for floods, droughts, and extreme storms. But getting there took time and patience.
“It’s very difficult to do climate change science with a short record,” Di Girolamo says. “You need decades of data to tease out the signal from the noise. That’s what MISR gave us.”
From pollution to prediction
In its early years, MISR revealed alarming levels of air pollution in places like India and eastern China. Even Di Girolamo was skeptical at first.
“When I saw how polluted it was, I thought there was no way this could be,” he recalled. “Then, when we did our validation exercise, it turned out we were actually underestimating the amount of pollution.”
That discovery led to health studies linking air pollution to mortality and disease, spurring international efforts to monitor and reduce emissions. Yet even as MISR uncovered the human toll of pollution, it also captured the slow but steady transformation of the atmosphere itself.
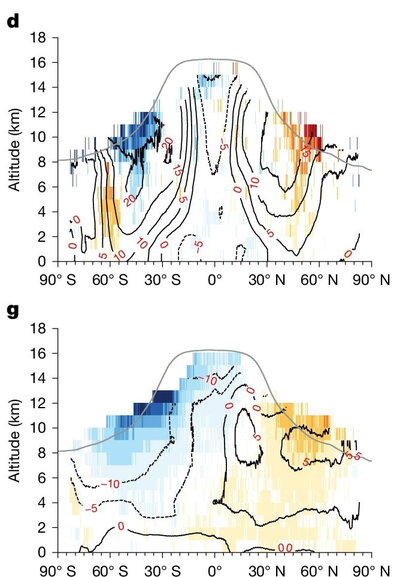
Published this July in Nature, Di Girolamo’s latest paper used two decades of MISR data to measure changes in the wind speeds of the subtropical and polar jet streams. The study confirmed predictions made by climate models: these high-altitude winds are intensifying and drifting poleward – a trend that could reshape global storm patterns and rainfall in the years ahead.
Di Girolamo described himself as “astonished and frightened” at the study’s findings. “We had to triple-check to make sure it was real. It’s exciting because it falls in line with the theory. The frightening part is that the theory makes some pretty dire predictions on the state of the climate caused by human-made endeavors.”
Scientists have long relied on “reanalysis data,” a blend of historical measurements and models to track these winds. But those records have limitations. “We have a lot of weather balloon launches, but that’s very sparse. You only have a couple hundred stations, mostly over land.”
Using MISR’s long-term record, Di Girolamo and his team validated the winds these models produce for the first time. “Reanalysis data requires verification. And we do that in this paper. We’re the first paper to verify the quality of the reanalysis winds data, which much of the community is using. The good news is that it’s generally pretty good except near the jets.”
The end of an era
For Di Girolamo, MISR’s end is bittersweet. The team, scientists, engineers, and managers, remained remarkably stable over decades.
“You know things are going really well when no one quits the mission,” he laughs.
He describes the feeling of closure as “a success, with a touch of sadness.”
“It’s been 20 years beyond what we ever imagined. Without those extra years, we couldn’t have made discoveries like this,” he says, referring to his recent paper in Nature. “Humankind’s ability to do this again would take another 35 to 50 years. It’s an irreplaceable record.”
Terra’s legacy will live on in its data and its discoveries—cited over 1 million times—and in the missions it helped inspire.
A new chapter: MAIA
Launching in 2026, the Multi-Angle Imager for Aerosols will take lessons from MISR—but with a new focus: human health. “MAIA learned from MISR,” Di Girolamo says. “But it’s a very different kind of mission.”
MISR showed where aerosol pollution exists, while MAIA will identify what it’s made of and how it affects people’s bodies. It will be the first NASA mission explicitly designed to study links between air quality and public health outcomes like asthma, cancer, and cardiovascular disease.
“When I started, there were no satellite measurements of atmospheric pollution. It just didn’t exist,” he says. “Now we have this incredible legacy. The MISR data will be used for centuries. It’s that useful. In a couple of hundred years from now, scientists will look back and say, ‘Man! Look at what they were able to do in the early 2000s.’”
He hopes MISR and MAIA offer data and inspiration for the next generation of scientists.
“There’s still so much we don’t know. That’s the exciting part,” he says. “We’ve learned a lot about the Earth system, but also seen how fragile it is. And that inspires us to keep asking questions, improving our models, and pushing the science forward.”
Explanation of Figure: The mean and trend values of wind speed and their zonal (U, positive eastward) and meridional (V, positive northward) components for CMV (a,d,g), ERA5_MS (b,e,h) and ERA5_AW (c,f,i) during 2000–2020. The black contour lines represent the mean values in m s−1 averaged over the 21-year MISR record. The trends in m s−1 decade−1 are coloured and use a different colour scale for each variable. The trends are calculated with deseasonalized monthly CMV anomalies that have passed the tightened FDR correction at the 5% level. The grey lines represent the mean tropopause heights averaged between 2000 and 2020.